Functions and Iterations
Learning to do repeated tasks in R
Meenakshi Kushwaha
18th August, 2022
Functions
When should you write function?
You should consider writing a function whenever you’ve copied and pasted a block of code more than twice (i.e. you now have three copies of the same code).”
- R for Data Science
Example of a repeated task
In the gapminder dataset calculate the range of population, gdp, and life expectancy
Your first function
Test-run your function
What did we need?
- name of the function
max_minus_min
- what do you want the function to do? OR body
round((max(x) - min(x)), 1)
- what does the function need to work? OR ingredient
x
A function returns the last statement it evaluates
Quiz
What will the following code return?
- 10
- 20
- 30
- Will give an error
How to re-use your function
- Step 1: Save your function as
.Rscript - Step 2: Source the script using
Demo
Good Practices
- descriptive names, use verbs for function names
- use snake case in names
- be consistent with naming
- use common prefix for a family of related functions
Other tips
- Use comments for #why. Code should explan the #how
- Shorcut (extract function)
Iterations
map() Function
FOR EACH ____ DO _____

map(.x, .f)
.x is a vector/list/dataframe
.f is the action that you want to do with each element of .x
Types of map() functions
map(.x, .f) is the main mapping function and returns a list
map_df(.x, .f) returns a data frame
map_dbl(.x, .f) returns a numeric (double) vector
map_chr(.x, .f) returns a character vector
map_lgl(.x, .f) returns a logical vector
Input to map() functions
- a vector (of any type)
- in which case the iteration is done over the entries of the vector
- a list
- in which case the iteration is performed over the elements of the list
- a data frame
- in which case the iteration is performed over the columns of the data frame
Example
Apply class() function to each column of gampminder data
$country
[1] "factor"

$continent
[1] "factor"

$year
[1] "integer"

$lifeExp
[1] "numeric"

$pop
[1] "integer"

$gdpPercap
[1] "numeric"Example
What is the number of distinct values in each column
  country continent      year   lifeExp       pop gdpPercap
      142         5        12      1626      1704      1704
Example
What is the median of all numeric columns?
        year      lifeExp          pop    gdpPercap
   1979.5000      60.7125 7023595.5000    3531.8470
When things get complicated, use ~
Sometimes you may want to define your own function and apply to each column
function(x) { x + 10 }
can be replaced with ~{. + 10}
Using ~ with map functions
Quiz
What is the output of the following code?
Using ~ with map functions
  country continent      year   lifeExp       pop gdpPercap
      142         5        12      1626      1704      1704
Using ~ with map functions
Fitting a linear model with different groups of the data
$Africa

Call:
lm(formula = lifeExp ~ pop, data = df)

Coefficients:
(Intercept)          pop
  4.816e+01    7.150e-08


$Americas

Call:
lm(formula = lifeExp ~ pop, data = df)

Coefficients:
(Intercept)          pop
  6.353e+01    4.587e-08


$Asia

Call:
lm(formula = lifeExp ~ pop, data = df)

Coefficients:
(Intercept)          pop
  5.992e+01    1.901e-09


$Europe

Call:
lm(formula = lifeExp ~ pop, data = df)

Coefficients:
(Intercept)          pop
  7.162e+01    1.650e-08


$Oceania

Call:
lm(formula = lifeExp ~ pop, data = df)

Coefficients:
(Intercept)          pop
  7.207e+01    2.545e-07
Using ~ with map functions
Fitting a linear model with different groups of the data
$Africa

Call:
lm(formula = lifeExp ~ pop, data = .)

Coefficients:
(Intercept)          pop
  4.816e+01    7.150e-08


$Americas

Call:
lm(formula = lifeExp ~ pop, data = .)

Coefficients:
(Intercept)          pop
  6.353e+01    4.587e-08


$Asia

Call:
lm(formula = lifeExp ~ pop, data = .)

Coefficients:
(Intercept)          pop
  5.992e+01    1.901e-09


$Europe

Call:
lm(formula = lifeExp ~ pop, data = .)

Coefficients:
(Intercept)          pop
  7.162e+01    1.650e-08


$Oceania

Call:
lm(formula = lifeExp ~ pop, data = .)

Coefficients:
(Intercept)          pop
  7.207e+01    2.545e-07
Strategy
- Solve for one element
- Turn it into a recipe
- Use
map()to solve for all elements
Demo
Reading multiple files with purrr package
Reading multiple files
We have data from different countries in seperate .csv files that we need to combine in a single dataset for analysis
Reading multiple files
Step 2
Make a list of all the files
[1] "/Users/meenakshikushwaha/Dropbox/R projects/github/cstep-iterations/data/china_gm.csv"
[2] "/Users/meenakshikushwaha/Dropbox/R projects/github/cstep-iterations/data/india_gm.csv"
[3] "/Users/meenakshikushwaha/Dropbox/R projects/github/cstep-iterations/data/japan_gm.csv"
[4] "/Users/meenakshikushwaha/Dropbox/R projects/github/cstep-iterations/data/nepal_gm.csv"
Reading multiple files
Step 3
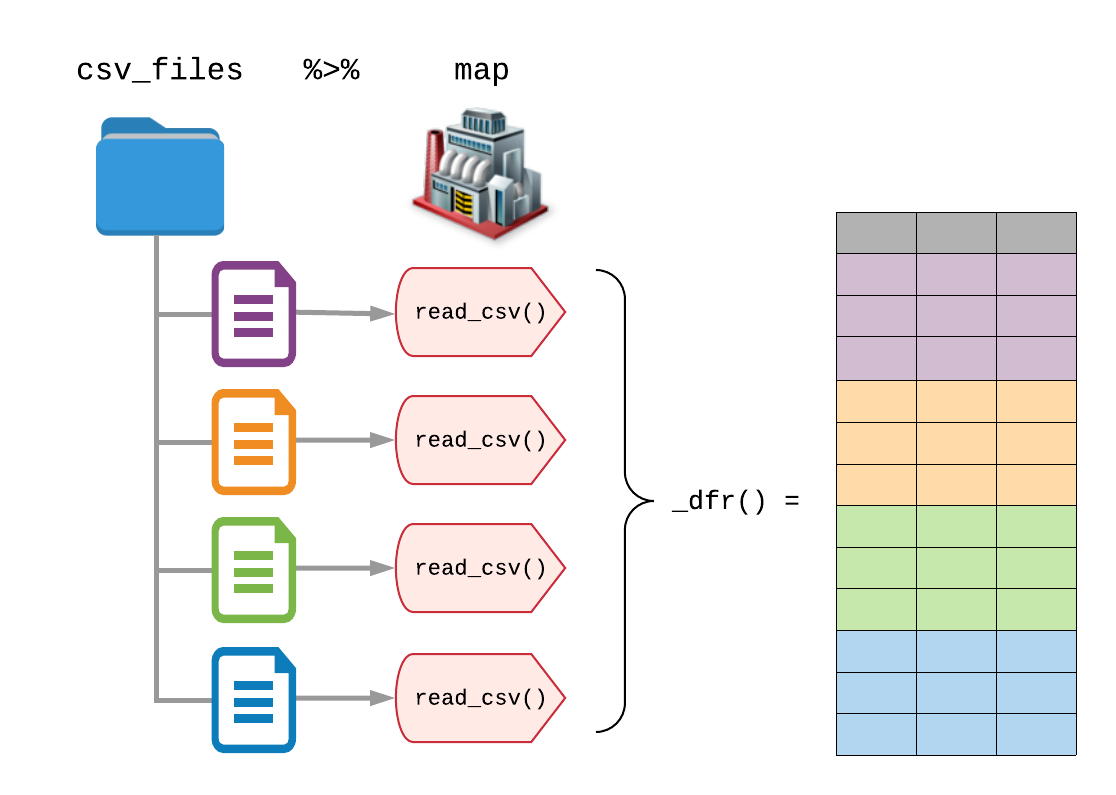
Read and combine all files using map_dfr()
# A tibble: 16 × 6
   country continent  year lifeExp       pop gdpPercap
   <chr>   <chr>     <dbl>   <dbl>     <dbl>     <dbl>
 1 China   Asia       1952    44   556263527      400.
 2 China   Asia       1957    50.5 637408000      576.
 3 China   Asia       1962    44.5 665770000      488.
 4 China   Asia       1967    58.4 754550000      613.
 5 India   Asia       1952    37.4 372000000      547.
 6 India   Asia       1957    40.2 409000000      590.
 7 India   Asia       1962    43.6 454000000      658.
 8 India   Asia       1967    47.2 506000000      701.
 9 Japan   Asia       1952    63.0  86459025     3217.
10 Japan   Asia       1957    65.5  91563009     4318.
11 Japan   Asia       1962    68.7  95831757     6577.
12 Japan   Asia       1967    71.4 100825279     9848.
13 Nepal   Asia       1952    36.2   9182536      546.
14 Nepal   Asia       1957    37.7   9682338      598.
15 Nepal   Asia       1962    39.4  10332057      652.
16 Nepal   Asia       1967    41.5  11261690      676.
Using map_dfr()

The additional _dfr() tells purrr to return a data frame (df) by row-binding each element together (r)
Source: Blog by Garrick Aden-Buie